
Key Takeaways
- IRR (Internal Rate of Return) measures the profitability of a rental property over time, factoring in cash flow and appreciation.
- It’s a more precise metric than ROI because it accounts for when money comes in and out.
- Knowing how to calculate rental property IRR helps investors compare deals objectively.
- Typical “target IRRs” range from 8–12% for residential and 15–20% for commercial investments.
- mogul uses IRR to help investors evaluate fractional real estate opportunities confidently and efficiently.
Last Updated October 2025
Disclaimer: The information provided in this guide is for educational purposes only and does not constitute financial, tax, or legal advice. Always consult with a licensed professional before making any financial or investment decisions.
In real estate investing, rental property IRR (Internal Rate of Return) is the gold-standard metric for seeing whether your money’s pulling its weight, and how fast it’s growing. Unlike simple return metrics like ROI, which only consider total profit, IRR reflects the time value of money, recognizing that a dollar earned today is worth more than one earned five years from now.
For investors, IRR helps answer the question: “What’s the annualized rate of return I’m actually earning once cash flow and appreciation are factored in?” That single number helps you compare deals, build a portfolio, and see exactly how your money’s performing over time.
At mogul, IRR is one of the core metrics used to assess fractional real estate investments. It helps investors evaluate properties not just for short-term gains, but for overall profitability across the entire holding period.
What Is IRR (Internal Rate of Return)?
The Internal Rate of Return (IRR) is the annualized rate of return that equates the present value of a property’s future cash flows to the original investment amount. In simple terms, IRR is the discount rate that makes the Net Present Value (NPV) of all cash inflows and outflows equal zero.
IRR considers when money is earned, not just how much is earned, making it far more insightful than traditional ROI. Investors use IRR to estimate how efficiently their capital is growing over time, especially in assets like rental properties where both cash flow and appreciation play key roles.
In practical terms:
- A higher IRR usually signals a stronger investment (all else equal).
- A lower IRR might indicate slower returns or delayed cash flow.
Why IRR Matters in Real Estate Investing
Spreadsheets don’t lie, but they don’t tell the whole story. That’s where IRR steps in and shows what the numbers really mean. Here’s how it adds real value:
- Evaluates long-term performance: IRR captures the full life cycle of an investment, from purchase to sale.
- Helps compare opportunities: Investors can weigh multiple deals with different cash flow structures on an equal basis.
- Incorporates timing: Early cash flows increase IRR because capital is returned sooner and can be reinvested.
- Supports decision-making: Investors often set a target IRR that must be met before pursuing a property.
Many investors rely on IRR when comparing different property types, like short-term rentals, multifamily units, or fractional ownership opportunities. It helps them gauge not just profit, but performance, how quickly capital returns, and how hard it keeps working once it does. In real estate, those differences matter. For example, two properties may both return $100,000 in total profit, but the one that does so faster will have a higher IRR.
Another advantage? IRR can highlight how a property performs under various scenarios, such as renovations, market dips, or refinancing. When paired with complementary metrics like cash-on-cash return or equity multiple, IRR gives investors a 360-degree picture of profitability over time, one that aligns perfectly with how mogul evaluates properties.
In short, IRR gives investors a clear, data-backed view of how efficiently their money is working over time, something every mogul-minded investor wants to know.
How to Calculate Rental Property IRR Step by Step
IRR calculations might look complex, but breaking them into steps makes the process easy to follow. Here’s a clear walkthrough for determining IRR for a rental property.
While spreadsheets and formulas may sound intimidating, calculating IRR is simpler than it looks. The process breaks down into logical steps that reflect the natural flow of any property investment, from buying and earning rent to selling and cashing out. Each step captures one piece of the financial puzzle, and together, they show the true velocity of your money. The key is consistency: input every cash inflow and outflow on the same timeline to keep your calculations accurate and reflective of real conditions.
Step 1 – Identify the Initial Investment
Start with the total upfront cost, which includes:
- Property purchase price
- Closing fees
- Renovations or initial upgrades
- Any legal or inspection costs
Example:
If you purchase a property for $250,000, pay $10,000 in closing costs, and spend $15,000 on improvements, your initial investment equals $275,000.
This total forms the first (negative) cash flow in your IRR calculation, representing the money going out.
Step 2 – Estimate Annual Cash Flows
Next, estimate your net annual rental income by subtracting all operating expenses from total rent collected.
Example:
If your property rents for $2,000 per month, and expenses (like taxes, maintenance, and management) total $600 per month, your net cash flow is $1,400 per month, or $16,800 per year.
You’ll input this number as a positive annual cash flow in your IRR formula.
Remember that cash flow isn’t static; it fluctuates with seasons, vacancies, and maintenance costs. Smart investors plan for the unsexy stuff, vacancies, repairs, the odd surprise bill, so their numbers stay real, not rosy. Track every recurring cost, management, insurance, and utilities, so your net figure reflects reality, not optimism.
To simplify this, mogul’s property dashboards display projected annual cash flows for every listing, helping investors model their own IRR scenarios with accurate baseline data. This transparency eliminates guesswork and builds confidence in your financial projections.
Step 3 – Estimate the Future Sale Price
After your planned holding period, say, five or ten years, estimate what you could sell the property for, then subtract selling costs (e.g., agent commissions, fees).
Example:
If you expect your $275,000 property to appreciate 3% annually for 5 years, its projected value is roughly $318,500.
After 6% selling costs, your net sale proceeds would be around $299,400, which becomes your final positive cash flow.
Step 4 – Compile the Cash Flows
Now, organize your data chronologically:
- Year 0: -$275,000 (initial investment)
- Year 1–5: +$16,800 (annual cash flow)
- Year 5: +$299,400 (sale proceeds)
This timeline of inflows and outflows represents your investment’s total cash performance.
You can calculate IRR manually using trial and error, or, more efficiently, use Excel’s IRR function or financial software.
Step 5 – Calculate IRR
In Excel, you can use the =IRR() function to calculate your investment’s internal rate of return automatically:
=IRR({-275000, 16800, 16800, 16800, 16800, 316200})
Excel will return the percentage rate at which the NPV equals zero, in this case, approximately 11.3%.
Don’t love spreadsheets? mogul’s platform runs these numbers for you faster than you can type ‘=IRR.
In practice, small variations in cash flow timing can change the IRR significantly. For instance, receiving rent a month earlier each year slightly increases the overall rate, while delays can pull it down. That’s why investors often run multiple IRR scenarios, best case, base case, and conservative case, to understand potential outcomes.
mogul’s analytics tools perform these sensitivity tests automatically, showing how small adjustments in income or appreciation affect projected returns. It’s like seeing every possible version of your investment story before making a move.
Visual Reference:
The chart below illustrates how IRR is calculated for a rental property, showing the relationship between investment, annual cash flow, and final sale proceeds.
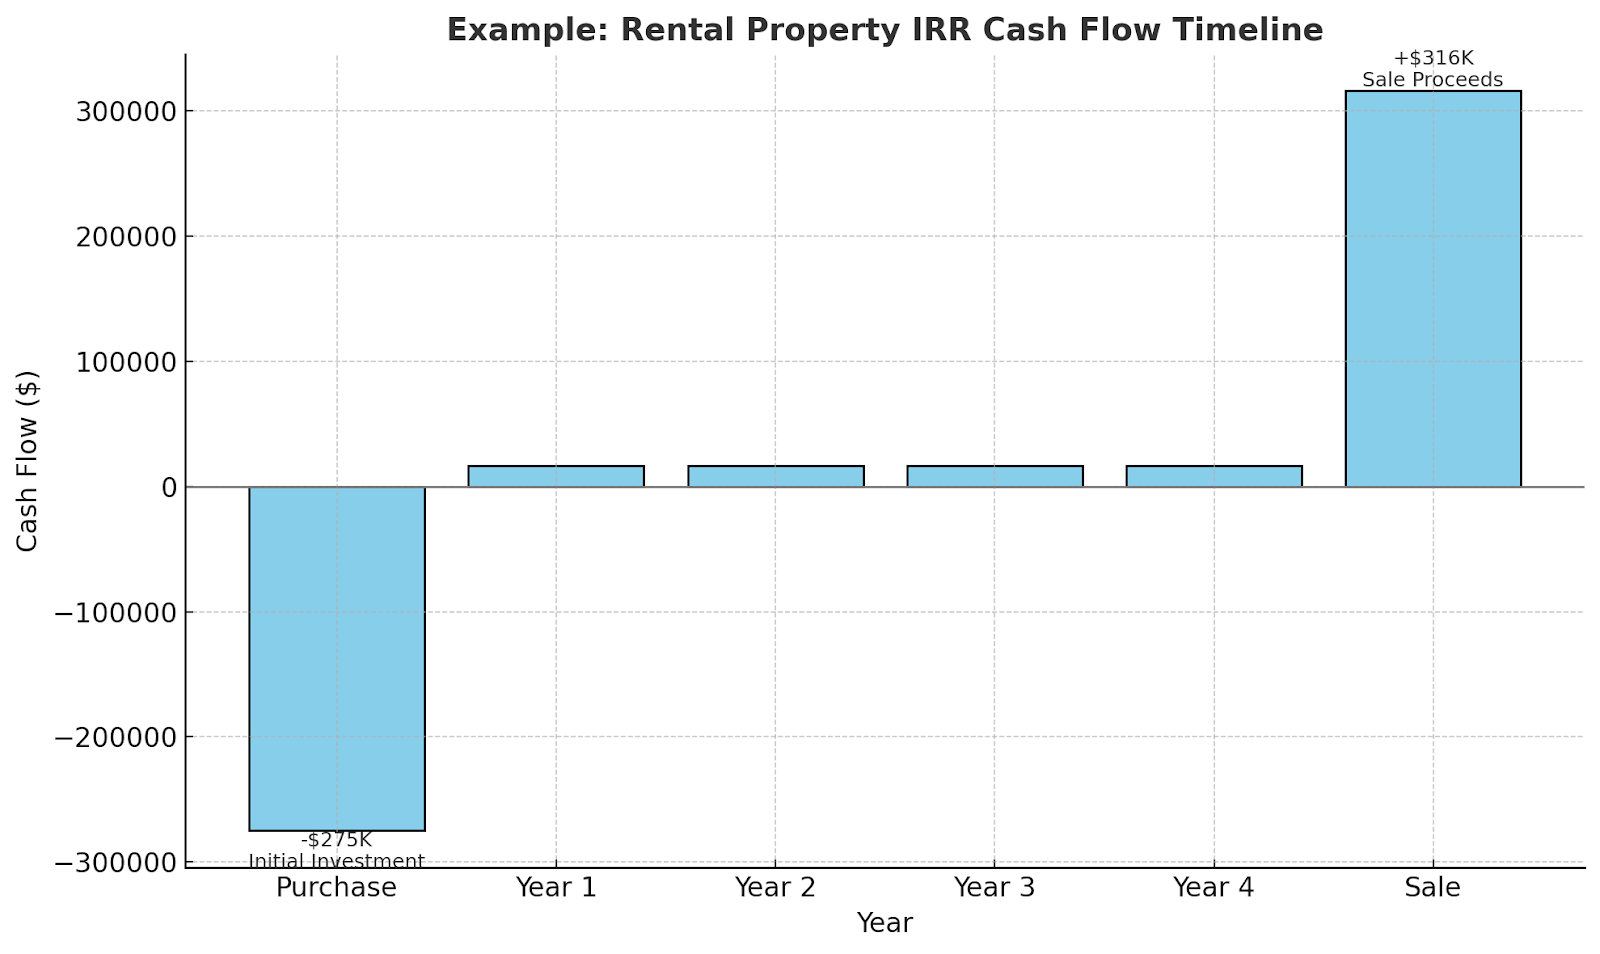
Alt text: Example of how to calculate the internal rate of return (IRR) for a rental property using Excel and cash flow data.
Rental Property IRR Example
Imagine an investor purchases a property for $300,000, with total upfront costs of $15,000, making the total investment $315,000.
They collect $1,500 monthly in net income ($18,000 per year) and sell the property after 5 years for $365,000 after costs.
Cash Flow Breakdown:
- Year 0: -$315,000
- Years 1–5: +$18,000 each
- Year 5: +$365,000
Using Excel’s =IRR() function:
=IRR({-315000, 18000, 18000, 18000, 18000, 383000})
The resulting IRR is about 11.8%, meaning the investor’s money grew at roughly that annualized rate over the holding period.
This example shows how combining consistent rental income with property appreciation can lead to strong, steady returns, something mogul investors aim to identify through data-driven analysis.
Factors That Influence IRR
Several variables directly impact your IRR results:
- Purchase Price: Lower upfront costs boost IRR.
- Cash Flow Timing: Earlier returns lift IRR; delayed returns lower it.
- Appreciation Rate: Faster appreciation increases overall profitability.
- Holding Period: Shorter holding periods amplify the annualized rate.
- Unexpected Costs: Maintenance, taxes, and vacancies can reduce IRR.
- Exit Price: Your final sale price (net of fees) is one of the largest IRR drivers.
Understanding these levers helps investors adjust expectations and strategies to meet their target returns.
What Is a Good IRR for a Rental Property?
There’s no universal “perfect” IRR; it depends on the market, property type, and investor goals. However, general benchmarks include:
- Typical Range: A solid IRR for rental properties generally falls between 12% and 18%, reflecting a strong mix of reliable income and appreciation potential. Returns below 10% can still work for low-risk, stabilized assets in mature markets but may offer limited upside.
- High-Risk, High-Return Deals: IRRs above 20% are usually tied to higher-risk opportunities, like value-add projects, major renovations, or properties in emerging markets, where greater uncertainty comes with the potential for outsized gains.
Source: Rentana, Sept. 2025
It’s also worth noting that what’s “good” for one investor might not suit another. A risk-tolerant investor might pursue higher IRRs through emerging markets or value-add properties, while a conservative investor may prefer stable, lower-yielding assets in major metros. Market cycle plays a role, too, during high-interest-rate environments, target IRRs naturally rise to compensate for borrowing costs.
Beyond numbers, factors like tax strategy, leverage, and inflation all shape the ideal return threshold. By using mogul’s data-driven listings, investors can view projected IRRs side by side and choose opportunities aligned with both their comfort level and long-term objectives.
mogul’s portfolio averages an 18.8% IRR, placing it near the top of typical commercial and value-add performance ranges. This level of return reflects the platform’s focus on sourcing strong operators and high-quality assets that deliver both income and growth potential.
At mogul, these insights are baked into property evaluations, helping investors understand how each opportunity aligns with their financial strategy.
Comparing IRR to Other Real Estate Metrics
While IRR is one of the most comprehensive ways to assess profitability, it’s not the only tool in a real estate investor’s kit. Understanding how it stacks up against other metrics provides better context for decision-making.
Cash-on-Cash Return
This measures the annual cash income earned on the cash invested. It’s a snapshot of short-term performance and doesn’t account for appreciation or resale profits.
Equity Multiple
The equity multiple shows how much total cash you get back relative to your original investment. A 2.0x equity multiple means doubling your money over the investment period, but it doesn’t show how long it took.
Return on Investment (ROI)
ROI is simpler: total profit divided by total cost. However, it ignores the time value of money, which can make longer projects look deceptively strong.
IRR combines the strengths of all these metrics by folding in both the timing and the magnitude of returns, offering a truer picture of real performance. For mogul investors, it’s the north star metric that aligns all financial data into one clear story.
Common Mistakes When Calculating IRR
Even pros can fumble the math if they overlook the small stuff. Common pitfalls include:
- Ignoring taxes: Property and income taxes significantly impact cash flow.
- Overestimating sale price: Assuming unrealistic appreciation can inflate IRR.
- Excluding maintenance or vacancies: Skipping real-world costs leads to misleading results.
- Misaligning time frames: Using inconsistent or uneven cash flow periods in calculations.
Another subtle mistake is relying solely on optimistic appreciation estimates without adjusting for inflation or market cycles. Real estate moves in waves, and even solid properties can underperform when macroeconomic conditions shift. Investors should run downside cases where appreciation slows or rent growth plateaus.
mogul keeps those blind spots in check by grounding every IRR projection in real-world comps and data, so your numbers stay sharp, not wishful.
Start Evaluating IRR with mogul
Understanding rental property IRR helps investors compare deals, plan exits, and make smarter decisions about where to allocate capital.
With mogul’s blockchain-backed platform, investors can explore fractional ownership opportunities in blue-chip properties, complete with IRR projections, appreciation insights, and monthly dividend potential.
Ready to see IRR in action?Explore current listings and discover how mogul helps investors turn insight into action, and action into ROI.
Disclaimer: The information provided in this guide is for educational purposes only and does not constitute financial, tax, or legal advice. Always consult with a licensed professional before making any financial or investment decisions.
Frequently Asked Questions (FAQs)
What Is a Good IRR for Rental Property?
A good IRR for rental property typically ranges from 8–12% for residential investments and 15–20% for commercial ones. The right target depends on risk tolerance, market conditions, and holding period.
Is 30% IRR Too High?
A 30% IRR is possible but rare; it usually signals short-term, high-risk opportunities like fix-and-flips. For stable rental portfolios, such returns may not be sustainable or realistic.
Is 10% a Good IRR?
Yes. A 10% IRR is generally considered a healthy return for long-term rental properties, especially in lower-risk markets with consistent cash flow and appreciation potential.